The development of new low-cost monitoring system requires extensive testing of potential sensors. Testing means:
- assessing the performance of the sensor: precision, accuracy, range of utilisation,
- assessing the influence of the environment: air relative humidity, temperature for example,
- how to communicate with the sensor, how many raw measures to do for each measure, how long to wait between each raw measures, etc.
We propose below a testing platform and its associated code to assess sensors used for water level monitoring. The whole physical platform is home-made and the system is controlled by an Arduino Uno which is connected to a computer to save all the measurements.
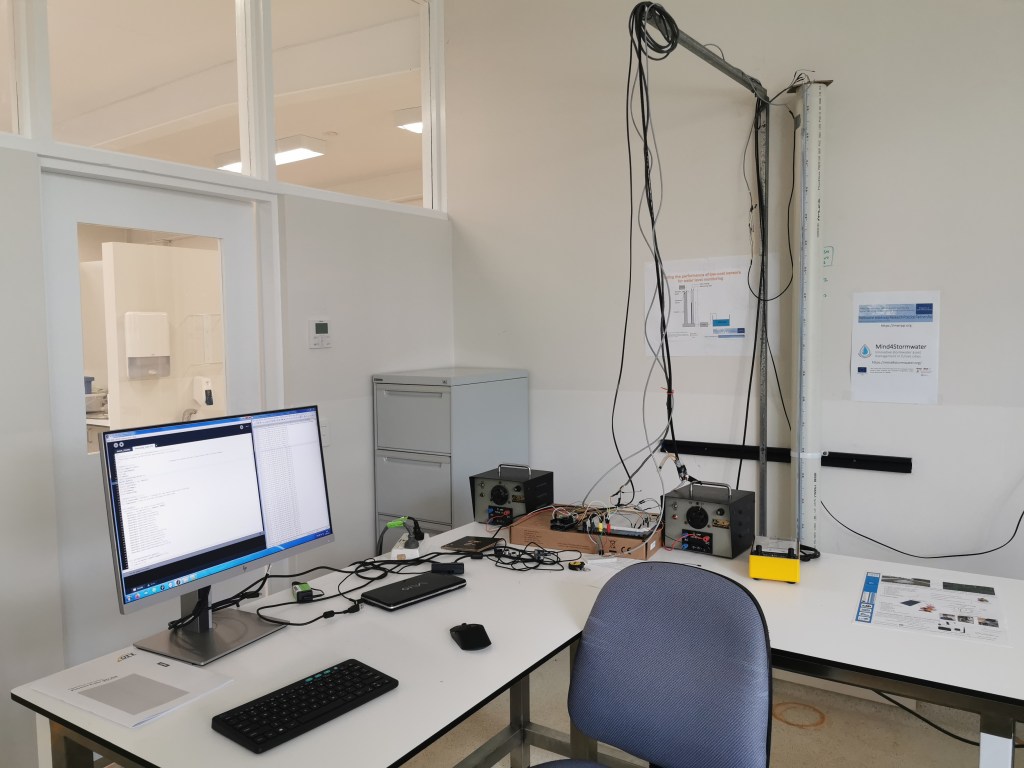
Description of the platform
The testing platform is constructed of 100 mm diameter polyvinyl chloride (PVC) pipe with a T-piece at the base. The height of the pipe and therefore range of water levels tested can be adjusted according to available space and desired application. We built a 2 meters height because most of our monitoring applications require water level up to less than 1.8 meters.

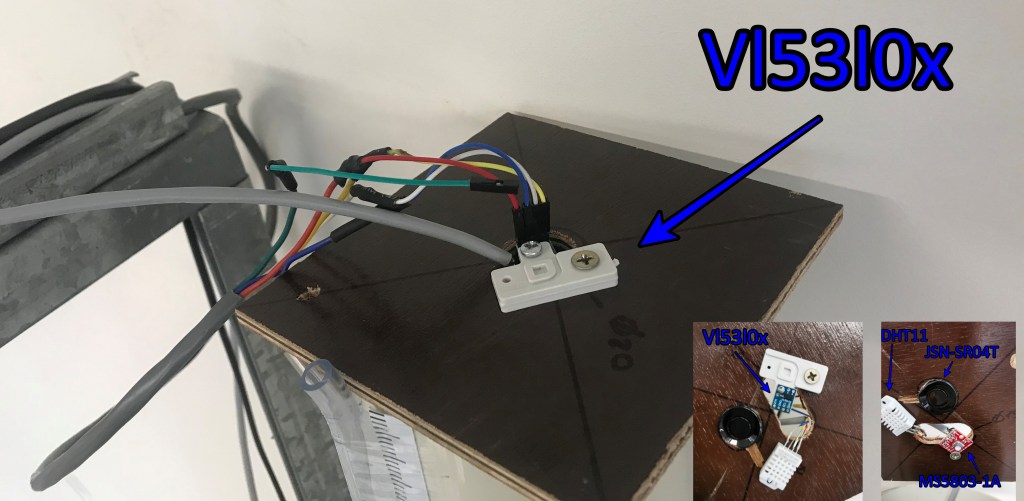
The platform is made to test any water level sensor. The sensors can be installed on the platform according to their measurement principle: non-contact sensors are positioned above the water and pressure sensors are installed at the base of the column. For pressure sensors, an additional sensor can be installed above the water if it requires atmospheric compensation. Environmental factors such as air temperature and relative humidity are measured during the whole experiment.
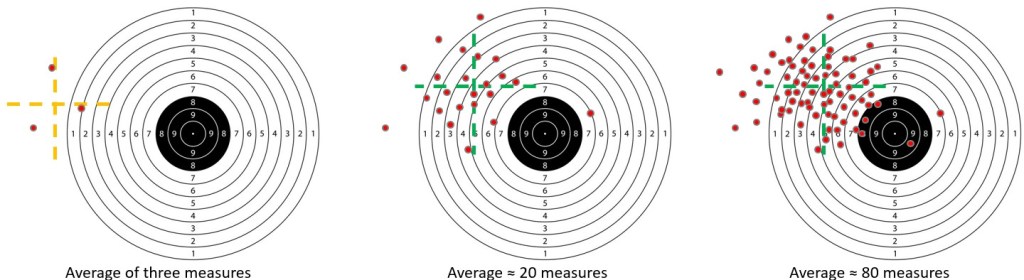
The precision is one important parameter to consider when using a sensor. The precision is the “closeness of agreement between indications or measured quantity values obtained by replicate measurements on the same or similar objects under specified conditions” (JCGM, 2012). The figure below show the importance of the number of measures for a sensor with a limited precision. If the repeated measures are very close, less measures are required and thus the measurement time is shorter (which is important for power consumption and response time).
Each experiment consisted of a single complete cycle of emptying the testing platform to minimum height (lower limit) followed by complete filling (upper limit). At the beginning of each experiment, the reference sensor was used to fill the column until the water level reached the upper limit (1.850 m). Once that water level was achieved, the system was idle for 15 seconds (default) to allow the water level to stabilise. For each level, by default 1,000 low-cost measures were made, 10 reference measures (1 every 100 low-cost measures), and 100 measures with the DHT22 sensor (1 every 10 low-cost measures). When all the measurements were finished for a level, the pump started for five seconds to decrease the water level. After five seconds, the pump switched off and a new measurement cycle began with a 15 second stabilisation time. When the water level was below 0.000 metres, the experiment continued with the water pumped in the other direction: the water level thus increased until it reached the upper limit. For each of the three low-cost sensors tested here (see section 2.3), this experiment was repeated three times in the same way to confirm the results obtained (i.e., nine experiments in total).
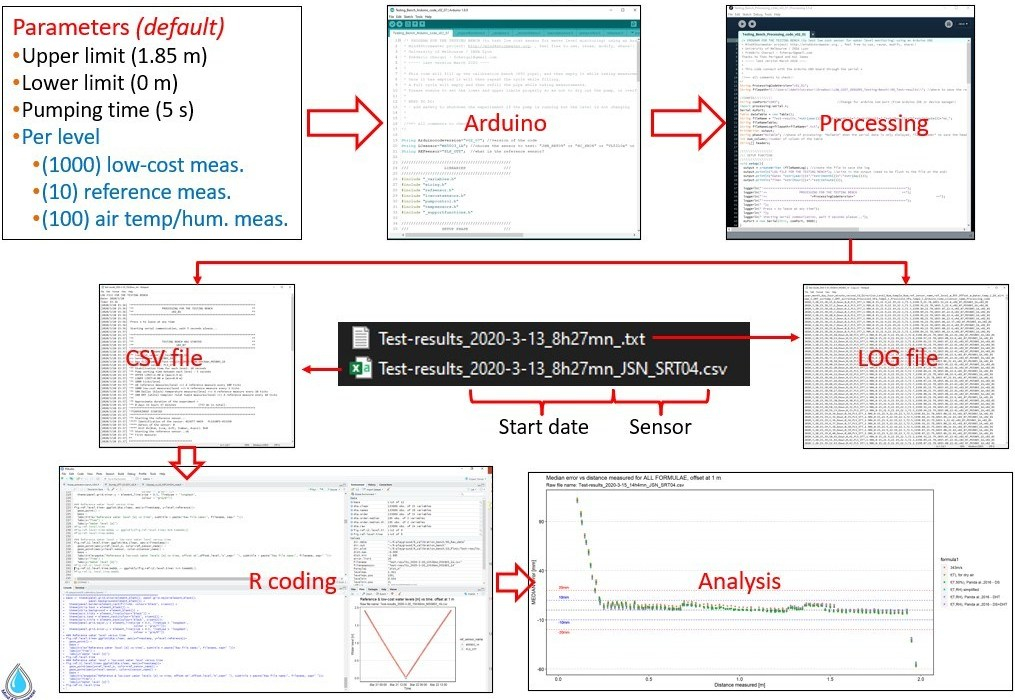
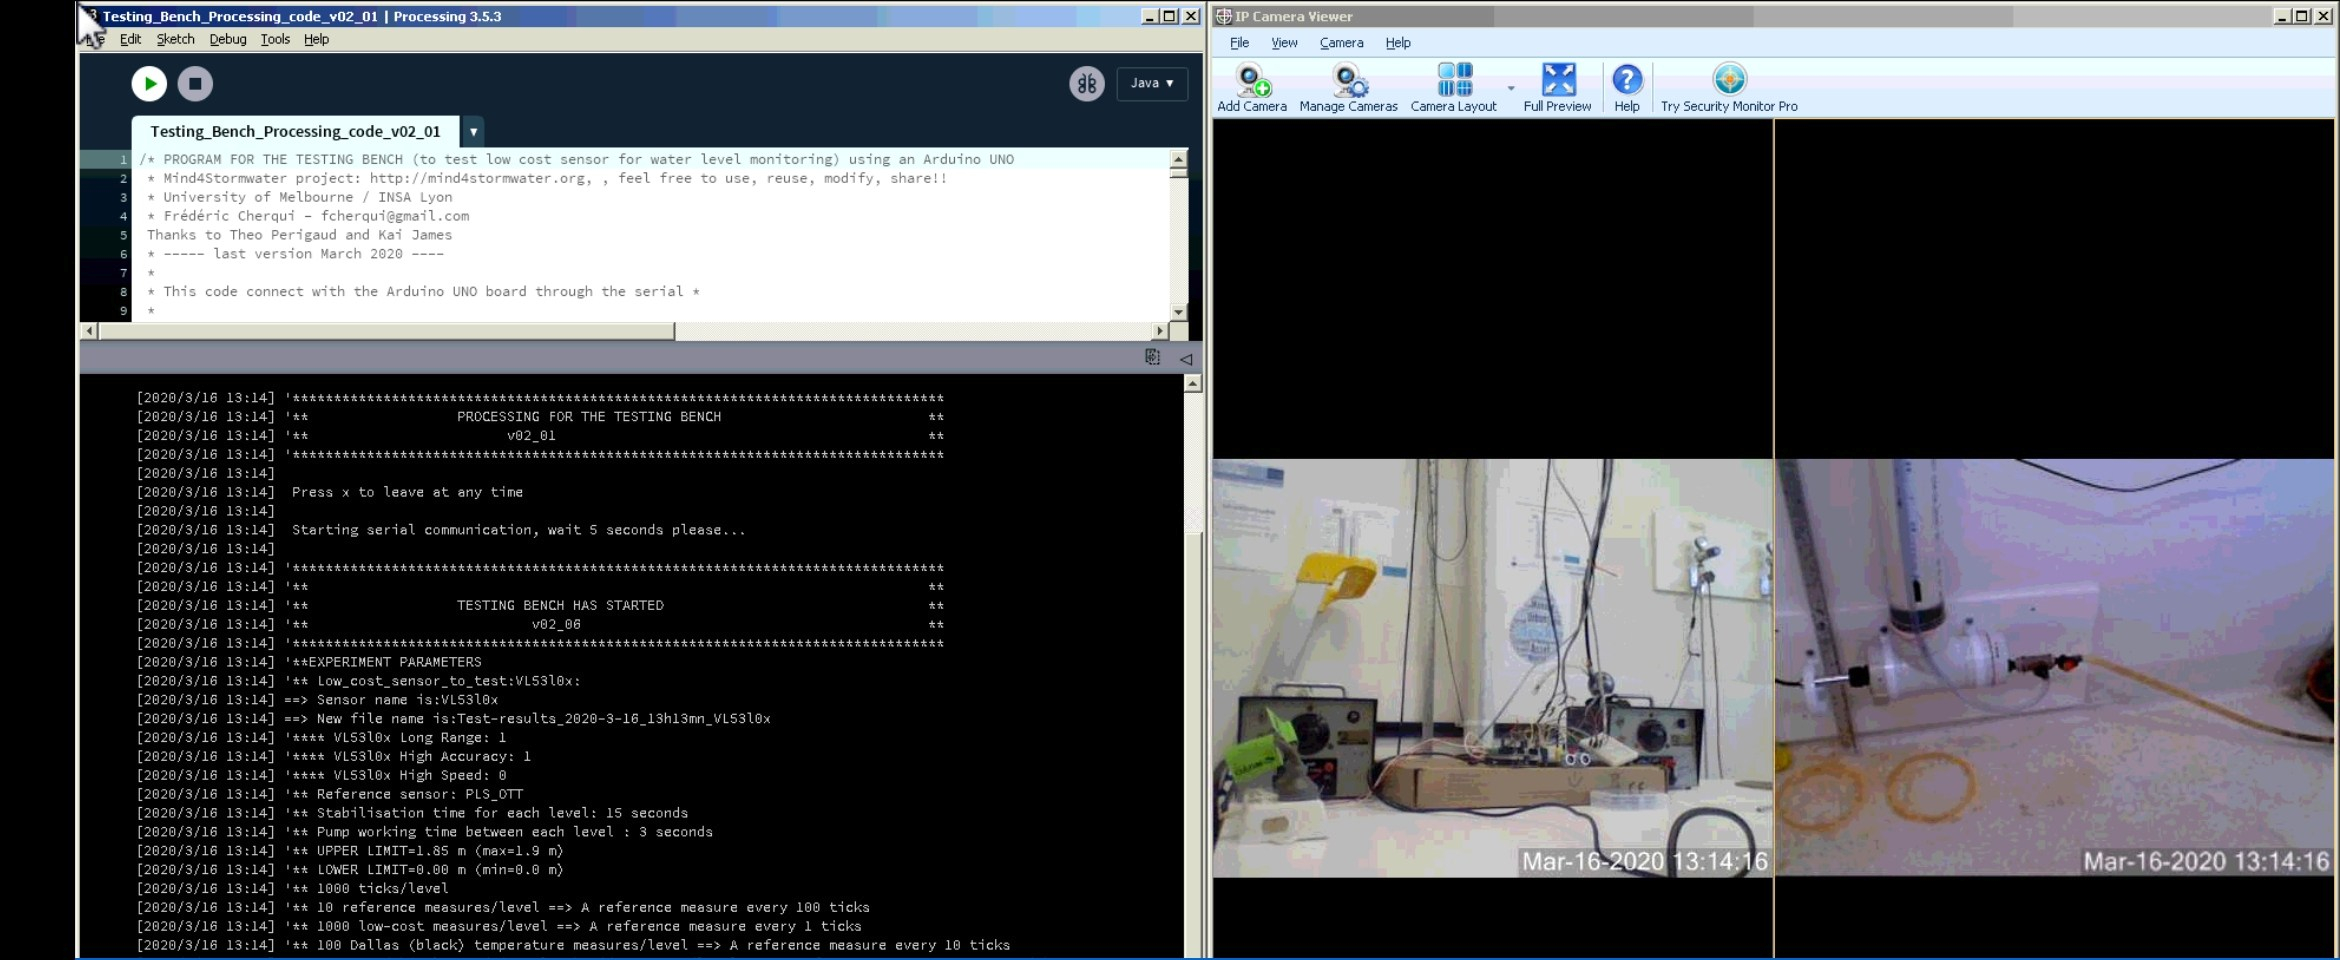
The platform automatically adjusts water levels such that all sensors can complete measurements at the desired frequency before each change in water level. The parameters of each experiment are controlled by an Arduino Uno board programmed with the Arduino IDE. The Arduino board communicates directly with all the sensors and controls the pump direction and functioning with three relays. The board sends all data in real time to a computer via serial cable using the Processing software. The Processing software collects all data and saves two files at the end of the experiment: a comma-separated values (CSV) file containing all measures timestamped, and a text file containing details describing the experimental parameters, and pump operation.
As the platform and protocol were fully automated, can be remotely controlled and includes safeguards. The experiment would automatically stop and trigger an alert if: 1) for any given water level, the difference between the first and last measure from the reference sensor exceeded 2 mm, 2) the water level exceeded safety upper and lower limits, and 3) the pump was active but the water level did not change.
Sensors tested for water level measurement
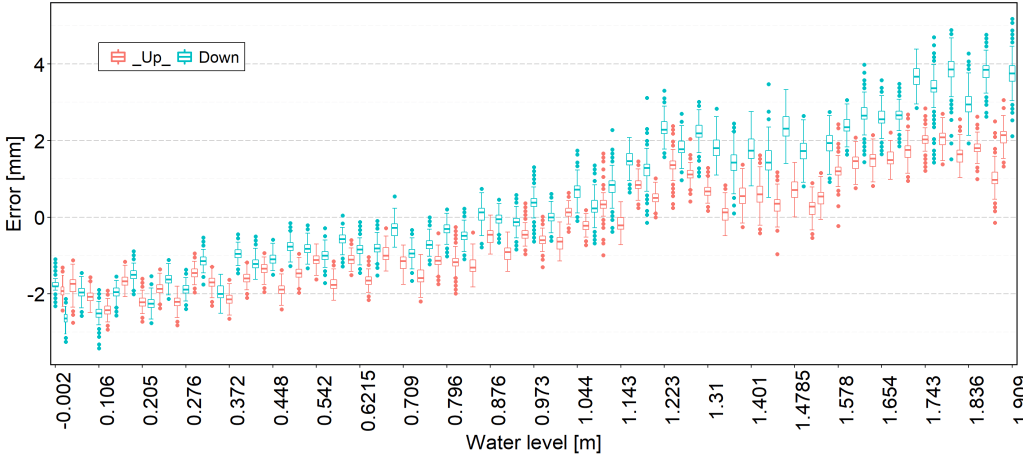
Several low-cost have already been tested and more will be in the future. For each sensor, the accuracy is measured by considering the median of the 1,000 measures per level and the precision is based on the dispersion of the 1,000 measures. The figure below presents an example of result for the low-cost pressure sensor MS5803-01BA pressure sensor: it is the boxplot of the error between the low-cost measure and the reference measure for the 1,000 measures for each water level.
We present below the summary of the main results, do not hesitate to contact us if you want more detailed information.
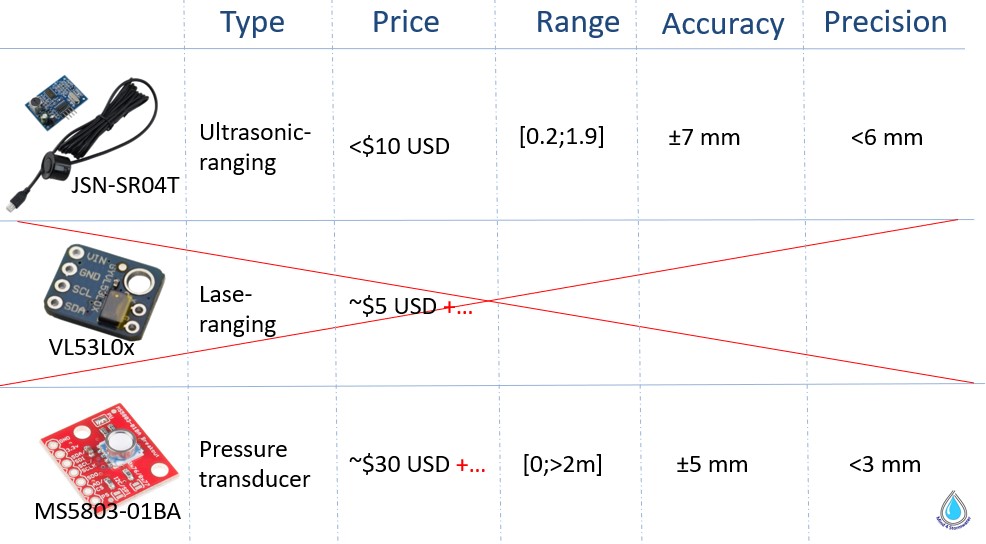
Both the ultrasonic (JSN-SR04T) and pressure (MS5803-01BA) sensors seem appropriate for water level monitoring in situations where an accuracy of ±10 mm is expected. The low-cost laser sensor VL530x is not appropriate for accurate water level monitoring, most likely because of the limited reflectivity of laser on the water surface.
Arduino and processing code
The code is accessible on Github:
https://github.com/fcherqui/Mind4stormwater/tree/master/Testing-platform
