The ‘Sunbury’ situation
The system is designed to a specific situation where the water level monitoring is done in a remote location with no network availability.

One major aspect is to have access to the real-time data, meaning that the data is not only save on locally (on a SD card) but also send in real-time. We have developed a solution adapted to this context and tested it on the Burnley campus of the University of Melbourne.
Some brief explanations
The system is real-time monitoring the temperature and the level of water in one of the ponds of the magnificent Burnley Garden.


The monitoring system consists of two parts:
- The monitoring system itself consisting in a sensor communicating via the SDI-12 protocol with a circuit board; the board will save the data on a SD card with the timestamp and send a copy of the data through LoRa,
- The “gateway” that receive the message from the monitoring system (through LoRa) and send it to the cloud with a GSM connection.

The system is designed to monitor water level in remote location with no GSM coverage. Thanks to the LoRa communication system, the distance between the monitoring system and the gateway can be very important and allows to install the gateway in a location with GSM coverage.
The general principle of the whole system is presented in the figure below.

The system remains at the early stage of development. For now, the main objectives are:
- to test the different communication protocols: SDI12, LoRa, and GSM
- to observe battery drainage of the system,
- to acquire feedback in order to optimize the set-up and the coding.
More detailed information on the materials and methods are given at the end of this article.
Live monitoring
The data is received every minute online and the figure below is updated every five minutes.
The monitoring system has been shut down after 6 months of experiment. The system has demonstrated his ability to provide a real-time monitoring of a stream even in a remote and isolated location.
Water level
The level is monitored with the CS451 pressure transducer from Campbell Scientific. The probe is submerged in the pond. As the probe is not lying at the bottom of the pond, the water level is given as a relative measure and not an absolute. It is necessary to precisely measure the distance between the probe and the bottom of the pond (offset) to obtain absolute level. The water level is given in kPa, and should be multiplied by 101.97162 in order to obtain a value in mm.

The missing data in the chart are mainly explained by the fact that we are updating the code in order to try some new functions. For example, we have added a function in the code to shut down for several hours the gateway when the battery level is too low; however wrong parameters can unexpectedly start this function. Some missing data can also be explained when we are trying new parameters and functions on the cloud platform (errors in the code will prevent the platform to read and store the data received.
Water temperature
The CS451 pressure transducer from Campbell Scientific can also monitor the water temperature. The temperature chart is showed below:

Description of the system
Monitoring system
The picture below presents the monitoring system during its development. The final monitoring system consists on the following elements:
- CS451 probe from Campbell Scientific,
- Arduino MKR1300 board (Arduino board + LoRa communication chip),
- Relay (commanded by the MKR board to control the power supply of the probe),
- SD card reader + card SD,
- Real-Time Clock
- Battery 12 V (to power the probe) and a voltage convert to power the MKR board
- Solar panel to recharge the 12 V battery

Gateway system
The picture below presents the monitoring system during its development. The final monitoring system consists on the following elements:
- Particle Electron circuit board (with a GSM chip),
- Arduino MKR1300 board (Arduino board + LoRa communication chip),
- Relay (commanded by the Particle Electron to control the power supply of the MKR),
- Battery 12 V (to power the probe) and a voltage convert to power the MKR board,
- Battery 3.7 V (the particle needs additional power to send data),
- Solar panel to recharge the 12 V battery.

Monitoring the monitoring…
That’s the main aim of this experiment: to assess the performance of the whole system and to identify optimization requirements. Thus, in addition to the monitoring of the water level and the temperature, the system send the voltage of every batteries, the LoRa signal strength, the GSM signal strength, the different timestamps given by each system (board connected to the probe, Particle Electron, Particle cloud platform and online Google Spreadsheet), and the log of every interaction with the Particle.
Monitoring system battery

Gateway system batteries

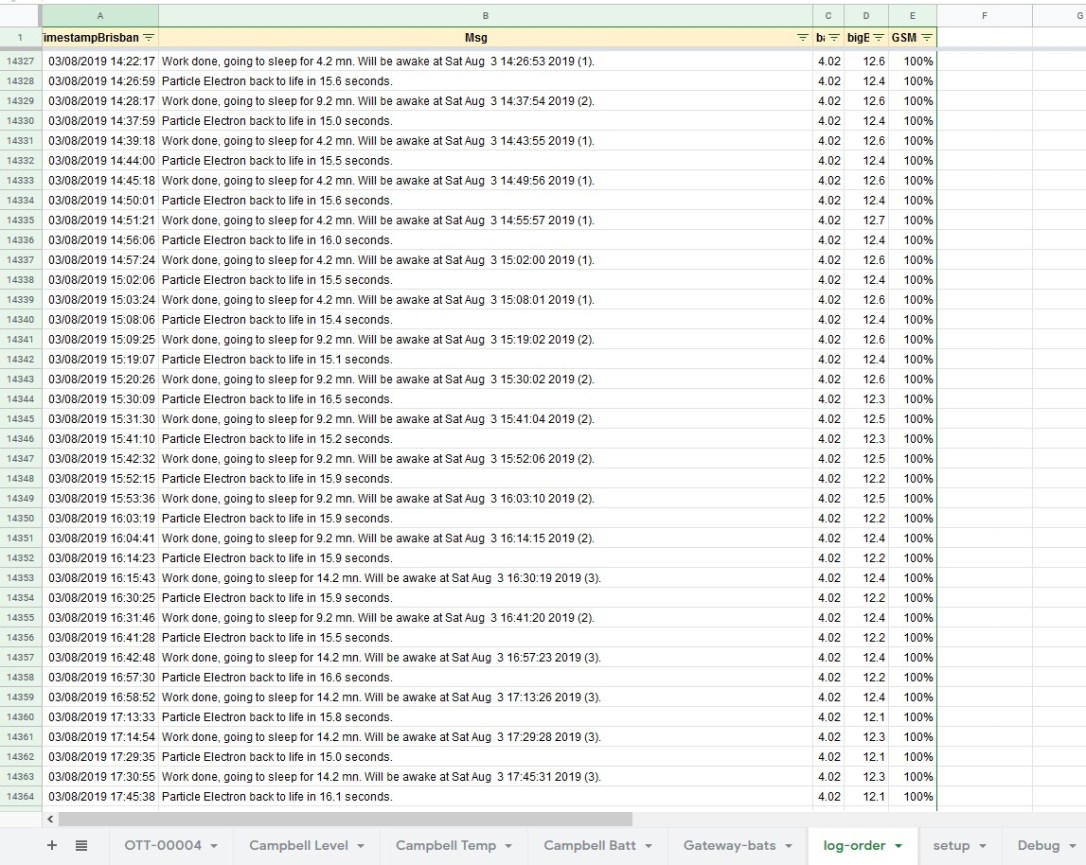
Log file